Hlanhla as a Data Scientist
As a student, we were given lab projects focused on stress–strain experiments. These experiments produced Excel files with hundreds of rows. The task was to plot charts—scatter plots, bar graphs, line charts, and the like. At the time, I didn’t know this counted as data analysis, but I enjoyed these kinds of projects.
Over time, I discovered MATLAB. It was fun, mathematical, and efficient. I started using it to perform complex mathematical equations and any calculations that required iterations or repetitions. Instead of Excel, it was MATLAB. Over the years, I gained proficiency with MATLAB, coupled with Simulink for mechatronics. I found that I enjoy data science, mathematical modeling, and statistics, so I started exploring them subtly as a student. Data science has been growing rapidly since 2020, and I kept asking myself how I best fit in as an engineer. I learned about large language models, machine learning, and the like. Trying to learn data science on my own as a student was difficult.
Ogilvy South Africa
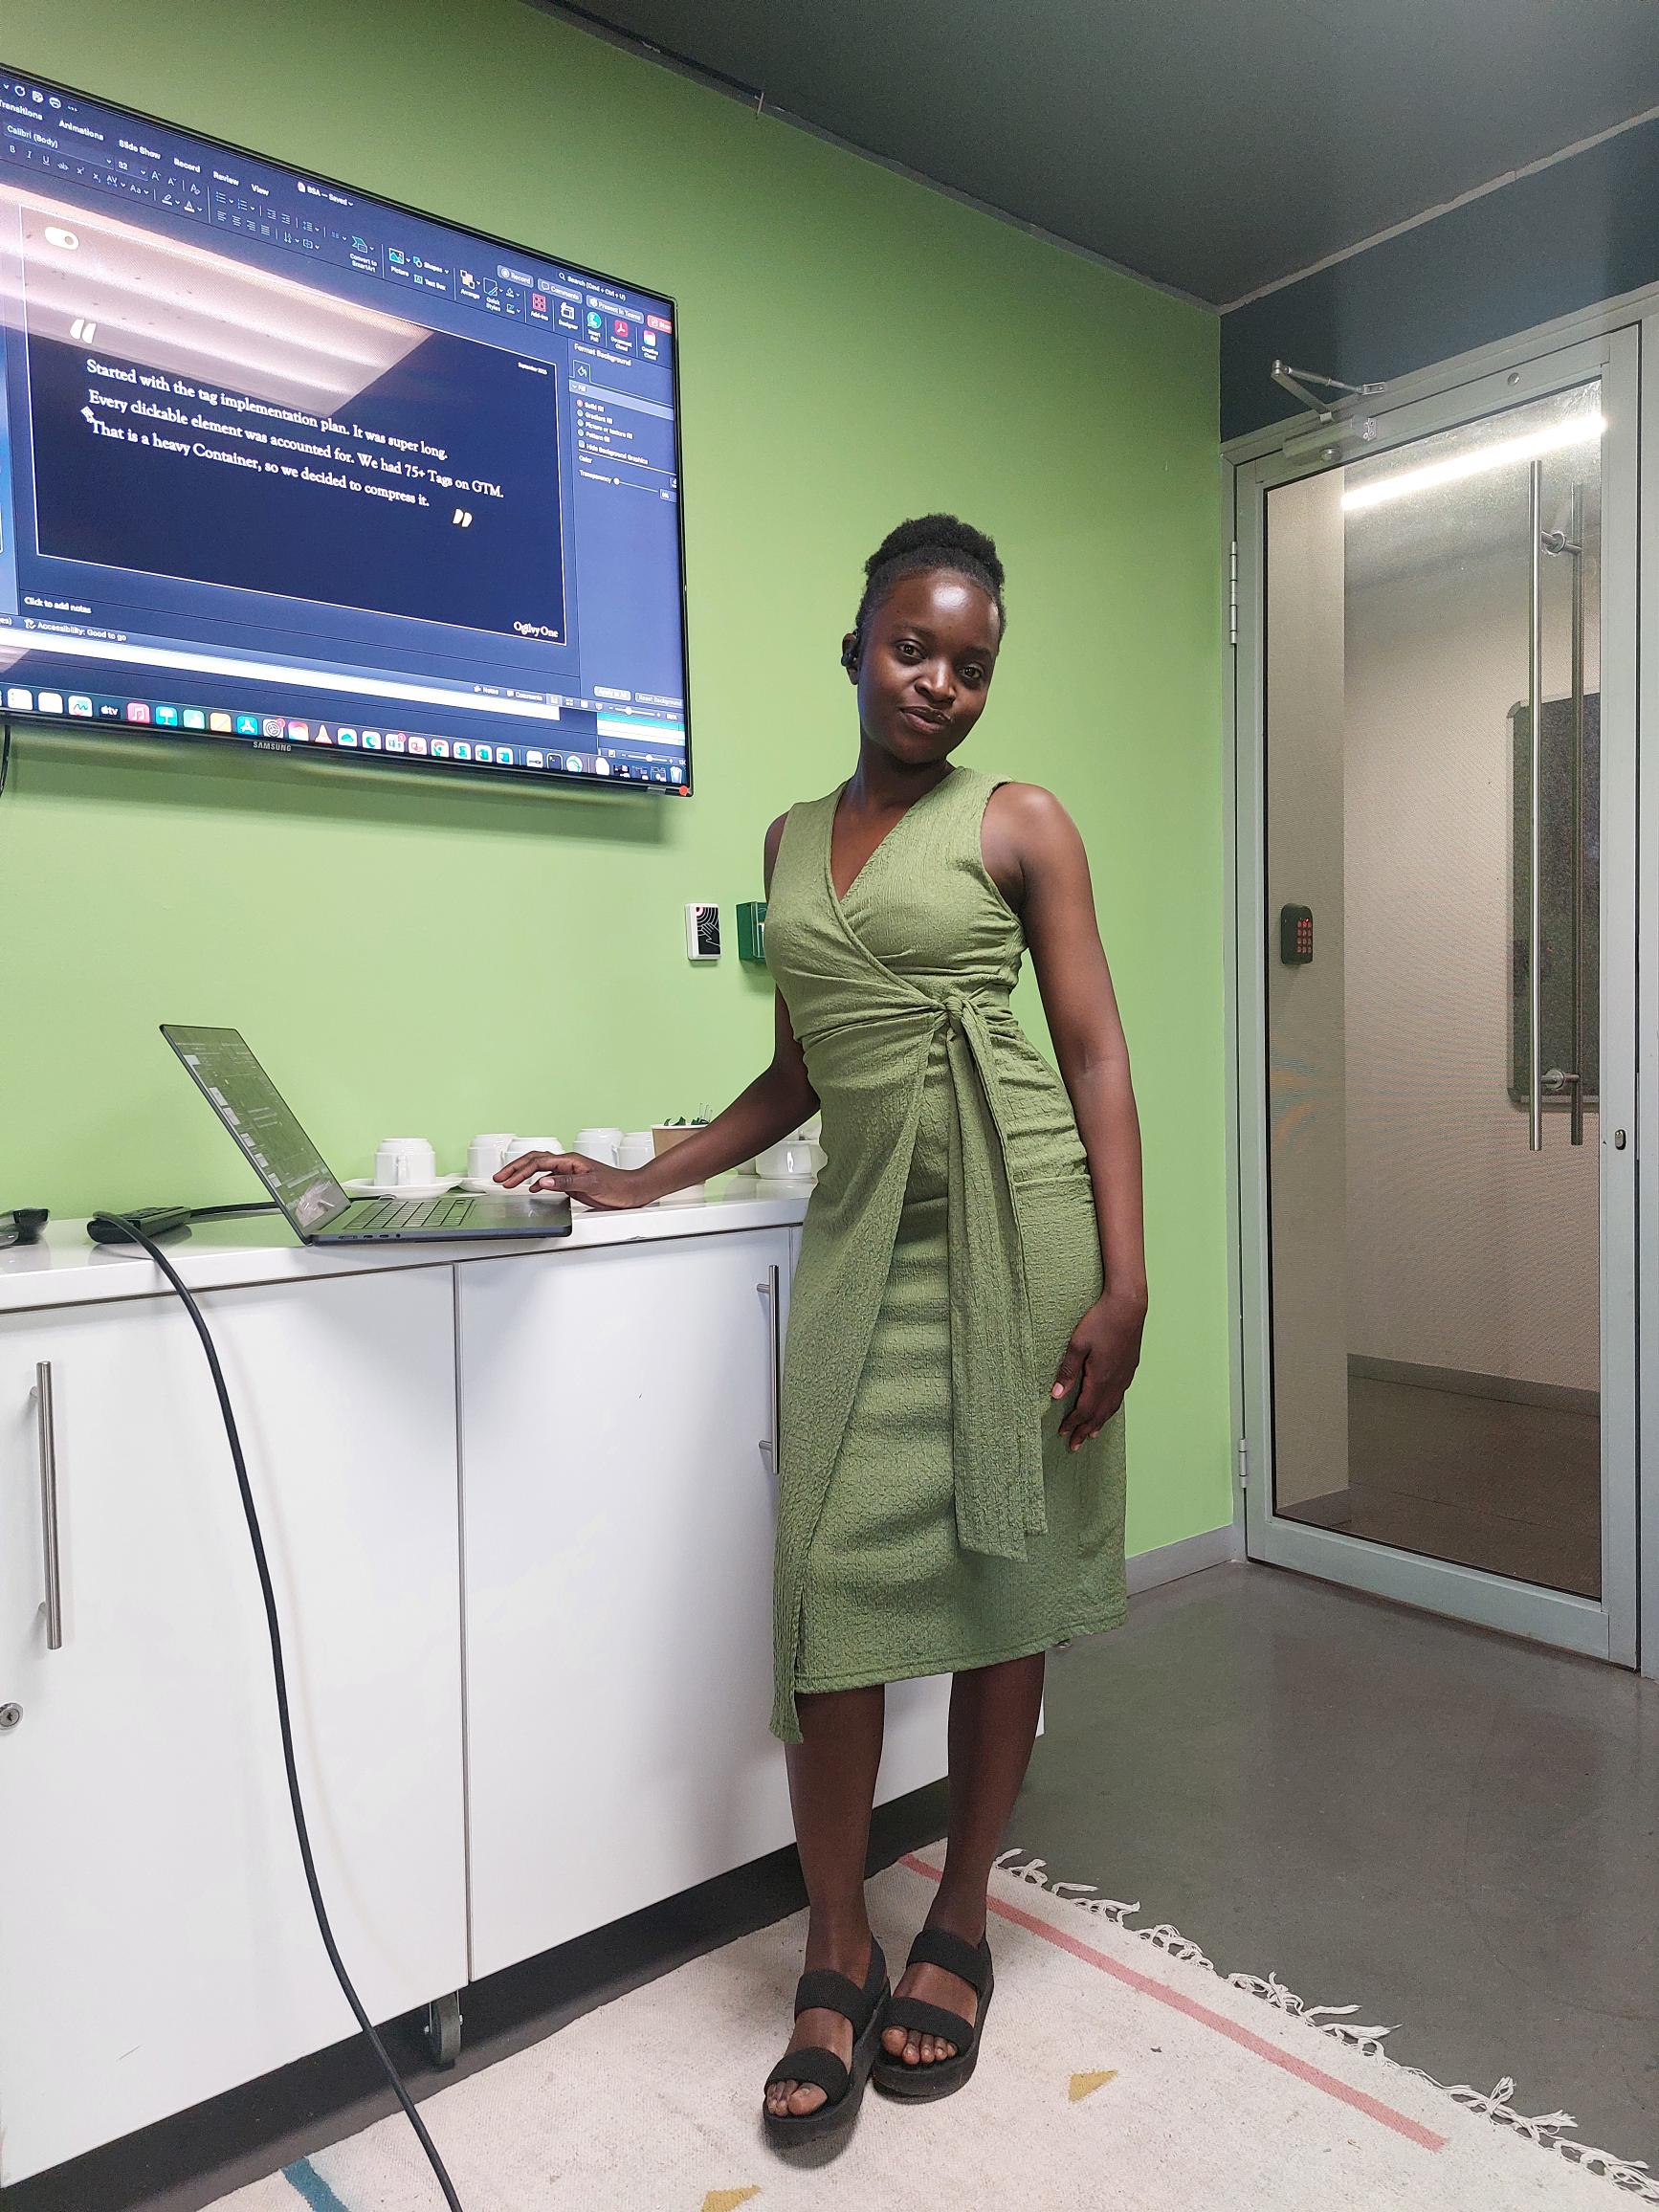
I was fortunate to join Ogilvy as a data science trainee. Ogilvy South Africa is a leading creative and marketing agency known for building strong, impactful brands. With offices in Johannesburg and Cape Town, it offers services in advertising, digital marketing, PR, and brand strategy. The agency works with major clients such as KFC, Cadbury, Volkswagen, and the Bill & Melinda Gates Foundation, delivering award-winning campaigns. I am working with leading experts in the data science field. I was assigned to Vodacom, Audi, and Brand South Africa as a trainee. The major platforms I am working on are Google Tag Manager, Google Analytics, Funnel, Looker Studio, and Adobe Analytics.
Skills and proficiencies
I use Excel for data cleaning, organization, and reporting. I am comfortable with formulas, pivot tables, and charting to turn raw data into clear, actionable insights. Excel is often my quick, reliable tool for exploring datasets and sharing results with non-technical teams. Python is my go-to language for automation and analysis. I use it to process data, run calculations, and build repeatable workflows. It helps me move from manual steps to efficient, scalable solutions that save time and reduce errors. R strengthens my work in statistics and modeling. I use it for hypothesis testing, exploratory analysis, and visualizing results, especially when the emphasis is on statistical rigor and interpretation.
With Tableau and Power BI, I build interactive dashboards and reports that make complex information easy to understand. I focus on clear visuals, thoughtful layouts, and meaningful metrics so stakeholders can make decisions confidently.
Learning I apply machine learning to real problems by preparing data, training and testing models, and evaluating performance. My focus is on practical outcomes—predicting, classifying, and forecasting in ways that improve decisions and processes.
With Keras and TensorFlow, I prototype and train neural networks. I have used them to build models that learn patterns from large datasets, including tasks involving structured data, images, and text. I pay attention to data preprocessing, training speed, and model reliability.
I am eager to grow by working with different companies and teams that value clear thinking, engineering discipline, and data-driven results. I want to contribute to projects that make a real impact, learn from experienced peers, and bring together my engineering background and data skills. I am open to new industries, new challenges, and environments where I can keep learning and deliver measurable outcomes.